

Index · updated 2026-10-22
Cost of capital
What money costs a builder, and what that money buys in compute. Four benchmark rates from FRED, read daily and monthly, with every move since the 2021 lows.
Prime rate · 3.25% to 7.00%
+375 bp
Rise from its low in this window: 2021-10-26 to 2026-10-21. FRED DPRIME
Four benchmark rates
Prime rate
What banks charge their best borrowers. Small business loans price above it.
7.00%
2026-10-21
- low 3.25% · 2021-10-26
- +375 bp
- 12 months
- −25 bp
- trend, last 12 months
- −8 bp a year
Baa corporate bonds
What a medium grade company pays to borrow for decades.
6.47%
2026-09-01
- low 3.28% · 2021-11-01
- +319 bp
- 12 months
- +64 bp
- trend, last 12 months
- +66 bp a year
10-year Treasury
What the US government pays. Long loans price from it.
4.96%
2026-10-22
- low 1.35% · 2021-12-03
- +361 bp
- 12 months
- +99 bp
- trend, last 12 months
- +105 bp a year
Fed funds
The overnight rate the Federal Reserve steers.
3.75%
2026-09-01
- low 0.08% · 2021-10-01
- +367 bp
- 12 months
- −47 bp
- trend, last 12 months
- −28 bp a year
Benchmark rates · percent a year
The price of money since the 2021 lows
Each line is a FRED series. Point at the chart, or focus it and use the arrow keys, to read every line on one date. Gold diamonds are dated events from the Chronicle.
2021-10-01 to 2026-10-22
Overview of the whole window. Drag across it to zoom, drag the box to pan, drag an edge to resize.
Chronicle events in this range
- 2021-10-18SEC staff report on the GameStop episode
- 2021-12-09First US Starbucks store votes to unionize
- 2022-01-04Quits hit a series high of 4.5 million
- 2022-03-04InstructGPT paper posted to arXiv
- 2022-04-01Amazon Labor Union wins at JFK8
- 2022-08-09CHIPS Act approved
- 2022-08-16Inflation Reduction Act adds a 1% buyback tax
- 2022-12-15Constitutional AI paper posted to arXiv
- 2023-01-23Microsoft extends its OpenAI partnership
- 2023-02-24Meta releases LLaMA to researchers
- 2023-03-15GPT-4 Technical Report posted to arXiv
- 2023-03-17"GPTs are GPTs" sizes labor exposure to LLMs
- 2023-04"Generative AI at Work" measures a 14% productivity gain
- 2023-04Goldman Sachs sizes the generative AI boost
- 2023-05-30Nvidia passes $1 trillion in market value
- 2023-08-22UPS Teamsters ratify a five-year contract
- 2023-09-18Musk: "universal high income" at the Senate AI forum
- 2023-09-19Anthropic announces its Long-Term Benefit Trust
- 2023-09-27Writers' strike ends with limits on AI
- 2023-10-26UAW and Ford reach a tentative deal
- 2023-10-30Biden signs the AI executive order
- 2023-11-01Bletchley Declaration on AI safety
- 2023-11-02Musk tells UK PM Sunak: universal high income
- 2023-11-17OpenAI board fires Sam Altman
- 2023-12Kenya cash experiment reports two-year results
- 2023-12-05SAG-AFTRA members ratify a contract with AI terms
- 2023-12-11Microsoft and the AFL-CIO form an AI partnership
- 2023-12-25Musk posts on X about universal high income
- 2023-12-27New York Times sues OpenAI and Microsoft
- 2024-01-14IMF: almost 40% of global jobs exposed to AI
- 2024-01-30Delaware court rescinds Musk's Tesla pay package
- 2024-02-27Klarna says its AI assistant does the work of 700 agents
- 2024-04-01California fast food minimum wage rises to $20
- 2024-04-23FTC bans noncompete agreements
- 2024-05Acemoglu publishes "The Simple Macroeconomics of AI"
- 2024-05-17Colorado signs the first broad state AI law
- 2024-05-26xAI raises $6 billion
- 2024-06-18Nvidia becomes the world's most valuable company
- 2024-08-01EU AI Act enters into force
- 2024-09-20Constellation signs a 20-year power deal with Microsoft
- 2024-10Amodei publishes "Machines of Loving Grace"
- 2024-10-08Nobel Prize in Physics goes to Hopfield and Hinton
- 2024-10-09Nobel Prize in Chemistry honors AlphaFold
- 2024-11-04Boeing machinists accept a contract after a 53-day strike
- 2025Alaska Permanent Fund dividend falls to $1,000
- 2025-01-08Dockworkers reach a tentative six-year deal with automation protections
- 2025-01-21Stargate Project announced
- 2025-01-22DeepSeek-R1 paper released
- 2025-02-10Anthropic Economic Index measures how AI is used at work
- 2025-02-24Claude Code launches as a research preview
- 2025-03-27CoreWeave prices its IPO
- 2025-06Meta takes 49% of Scale AI and hires its CEO
- 2025-07Microsoft cuts about 15,300 jobs while spending $80 billion on AI
- 2025-07-04One Big Beautiful Bill Act approved
- 2025-07-09Nvidia becomes the first $4 trillion company
- 2025-07-23White House releases America's AI Action Plan
- 2025-08US government takes a 10% equity stake in Intel
- 2025-09-02Anthropic raises $13 billion at a $183 billion valuation
- 2025-09-02Salesforce CEO says AI let it cut 4,000 support roles
- 2025-09-05Anthropic agrees to a $1.5 billion authors settlement
- 2025-09-22Nvidia plans to invest up to $100 billion in OpenAI
- 2025-09-29California signs the frontier AI transparency law
- 2025-10AMD gives OpenAI a warrant for up to 160 million shares
- 2025-10-28Amazon cuts about 14,000 corporate jobs
- 2025-10-28Microsoft and OpenAI finalize OpenAI's recapitalization
- 2025-10-29Nvidia becomes the first $5 trillion company
- 2025-11-06Tesla shareholders approve a pay package worth up to $1 trillion for Musk
- 2025-12-02Dells pledge $6.25 billion to seed Trump Accounts
- 2025-12-11Trump signs an order targeting state AI laws
- 2026U.S. labor share hits a record low
- 2026IRS raises 2026 retirement contribution limits
- 2026-01-08Challenger: 1.2 million job cuts in 2025, 54,836 tied to AI
- 2026-02-17Anthropic raises $30 billion at a $380 billion valuation
- 2026-02-18BLS: union membership rate was 10.0 percent in 2025
- 2026-04-30Big Tech guides to more than $700 billion of 2026 capex
- 2026-06-04SAG-AFTRA ratifies a 2026 contract with new limits on synthetic performers
- 2026-06-12SpaceX lists in a record IPO
- 2026-08Stanford "Canaries in the Coal Mine" paper (Brynjolfsson, Chandar and Chen), revised Aug 2026
- 2026-09-26CESifo paper finds no broad AI-linked rise in recent-grad unemployment
Chips show or hide a line; double-click a chip to show only that line. Rate shows the level; Change shows basis points since the start of the range.
Every move
Each step up and down
Every move of 25 basis points or more from the last listed level, from the first observation in the window.
| 7.00% | +25 bp | +375 bp | |
| 6.75% | −25 bp | +350 bp | |
| 7.00% | −25 bp | +375 bp | |
| 7.25% | −25 bp | +400 bp | |
| 7.50% | −25 bp | +425 bp | |
| 7.75% | −25 bp | +450 bp | |
| 8.00% | −50 bp | +475 bp | |
| 8.50% | +25 bp | +525 bp | |
| 8.25% | +25 bp | +500 bp | |
| 8.00% | +25 bp | +475 bp | |
| 7.75% | +25 bp | +450 bp | |
| 7.50% | +50 bp | +425 bp | |
| 7.00% | +75 bp | +375 bp | |
| 6.25% | +75 bp | +300 bp | |
| 5.50% | +75 bp | +225 bp | |
| 4.75% | +75 bp | +150 bp | |
| 4.00% | +50 bp | +75 bp | |
| 3.50% | +25 bp | +25 bp | |
| 3.25% | start | 0 bp |
19 rows · FRED DPRIME
| 6.47% | +37 bp | +312 bp | |
| 6.10% | +27 bp | +275 bp | |
| 5.83% | −25 bp | +248 bp | |
| 6.08% | +48 bp | +273 bp | |
| 5.60% | −40 bp | +225 bp | |
| 6.00% | +36 bp | +265 bp | |
| 5.64% | −65 bp | +229 bp | |
| 6.29% | −34 bp | +294 bp | |
| 6.63% | +61 bp | +328 bp | |
| 6.02% | +43 bp | +267 bp | |
| 5.59% | −67 bp | +224 bp | |
| 6.26% | +57 bp | +291 bp | |
| 5.69% | +57 bp | +234 bp | |
| 5.12% | +46 bp | +177 bp | |
| 4.66% | +37 bp | +131 bp | |
| 4.29% | +32 bp | +94 bp | |
| 3.97% | +62 bp | +62 bp | |
| 3.35% | start | 0 bp |
18 rows · FRED BAA
| 4.96% | −28 bp | +333 bp | |
| 5.24% | +29 bp | +361 bp | |
| 4.95% | +28 bp | +332 bp | |
| 4.67% | +26 bp | +304 bp | |
| 4.41% | −26 bp | +278 bp | |
| 4.67% | +28 bp | +304 bp | |
| 4.39% | +35 bp | +276 bp | |
| 4.04% | −26 bp | +241 bp | |
| 4.30% | +29 bp | +267 bp | |
| 4.01% | −25 bp | +238 bp | |
| 4.26% | −27 bp | +263 bp | |
| 4.53% | +28 bp | +290 bp | |
| 4.25% | −27 bp | +262 bp | |
| 4.52% | −25 bp | +289 bp | |
| 4.77% | +27 bp | +314 bp | |
| 4.50% | +26 bp | +287 bp | |
| 4.24% | +26 bp | +261 bp | |
| 3.98% | +25 bp | +235 bp | |
| 3.73% | −26 bp | +210 bp | |
| 3.99% | −34 bp | +236 bp | |
| 4.33% | −28 bp | +270 bp | |
| 4.61% | +25 bp | +298 bp | |
| 4.36% | −31 bp | +273 bp | |
| 4.67% | +25 bp | +304 bp | |
| 4.42% | +25 bp | +279 bp | |
| 4.17% | +30 bp | +254 bp | |
| 3.87% | −31 bp | +224 bp | |
| 4.18% | +26 bp | +255 bp | |
| 3.92% | −30 bp | +229 bp | |
| 4.22% | −27 bp | +259 bp | |
| 4.49% | −32 bp | +286 bp | |
| 4.81% | +32 bp | +318 bp | |
| 4.49% | +29 bp | +286 bp | |
| 4.20% | +25 bp | +257 bp | |
| 3.95% | +30 bp | +232 bp | |
| 3.65% | +26 bp | +202 bp | |
| 3.39% | −31 bp | +176 bp | |
| 3.70% | −38 bp | +207 bp | |
| 4.08% | +27 bp | +245 bp | |
| 3.81% | +26 bp | +218 bp | |
| 3.55% | −29 bp | +192 bp | |
| 3.84% | +31 bp | +221 bp | |
| 3.53% | −29 bp | +190 bp | |
| 3.82% | −40 bp | +219 bp | |
| 4.22% | +26 bp | +259 bp | |
| 3.96% | −28 bp | +233 bp | |
| 4.24% | +27 bp | +261 bp | |
| 3.97% | +25 bp | +234 bp | |
| 3.72% | −25 bp | +209 bp | |
| 3.97% | +27 bp | +234 bp | |
| 3.70% | +33 bp | +207 bp | |
| 3.37% | +25 bp | +174 bp | |
| 3.12% | +25 bp | +149 bp | |
| 2.87% | +27 bp | +124 bp | |
| 2.60% | −28 bp | +97 bp | |
| 2.88% | −28 bp | +125 bp | |
| 3.16% | −27 bp | +153 bp | |
| 3.43% | +39 bp | +180 bp | |
| 3.04% | +26 bp | +141 bp | |
| 2.78% | −27 bp | +115 bp | |
| 3.05% | +26 bp | +142 bp | |
| 2.79% | +31 bp | +116 bp | |
| 2.48% | +29 bp | +85 bp | |
| 2.19% | +26 bp | +56 bp | |
| 1.93% | +30 bp | +30 bp | |
| 1.63% | +28 bp | 0 bp | |
| 1.35% | −28 bp | −28 bp | |
| 1.63% | start | 0 bp |
68 rows · FRED DGS10
| 3.63% | −25 bp | +355 bp | |
| 3.88% | −34 bp | +380 bp | |
| 4.22% | −26 bp | +414 bp | |
| 4.48% | −35 bp | +440 bp | |
| 4.83% | −50 bp | +475 bp | |
| 5.33% | +25 bp | +525 bp | |
| 5.08% | +25 bp | +500 bp | |
| 4.83% | +26 bp | +475 bp | |
| 4.57% | +47 bp | +449 bp | |
| 4.10% | +32 bp | +402 bp | |
| 3.78% | +70 bp | +370 bp | |
| 3.08% | +75 bp | +300 bp | |
| 2.33% | +65 bp | +225 bp | |
| 1.68% | +47 bp | +160 bp | |
| 1.21% | +44 bp | +113 bp | |
| 0.77% | +44 bp | +69 bp | |
| 0.33% | +25 bp | +25 bp | |
| 0.08% | start | 0 bp |
18 rows · FRED FEDFUNDS
What compute costs a builder today: rented GPU hours and model API list prices, next to what money costs.
One snapshot each, no price history yet
GPU rental, per GPU-hour
Snapshot from Vast.ai, 2026-10-25 3:56 PM ET
Verified on-demand marketplace offers listed at fetch time, total price per hour divided by GPU count. A snapshot of listings, not a market average.
- RTX 5060$0.11 / hr · 1 offers
- RTX 3080$0.14 / hr · 3 offers
- RTX 5060 Ti$0.15 / hr · 3 offers
- RTX 3090 Ti$0.22 / hr · 1 offers
- RTX A5000$0.23 / hr · 3 offers
- RTX 5070$0.23 / hr · 2 offers
- RTX 3090$0.25 / hr · 2 offers
- RTX 4080$0.30 / hr · 1 offers
- RTX PRO 4000$0.34 / hr · 2 offers
- RTX 5070 Ti$0.34 / hr · 2 offers
- RTX 5080$0.34 / hr · 2 offers
- RTX 5000Ada$0.36 / hr · 2 offers
- RTX PRO 4500$0.38 / hr · 1 offers
- RTX A6000$0.40 / hr · 1 offers
- L40$0.46 / hr · 1 offers
- A800 PCIE$0.53 / hr · 2 offers
- RTX 4090$0.54 / hr · 5 offers
- CMP 170HX$0.54 / hr · 1 offers
- RTX 5090$0.71 / hr · 3 offers
- RTX PRO 5000$0.75 / hr · 4 offers
- RTX 6000Ada$0.79 / hr · 1 offers
- L40S$0.80 / hr · 1 offers
- RTX 5880Ada$0.80 / hr · 2 offers
- A100 PCIE$0.87 / hr · 1 offers
- RTX PRO 6000 Max-Q$1.07 / hr · 3 offers
- A100 SXM4$1.14 / hr · 1 offers
- RTX 6000D$1.26 / hr · 3 offers
- RTX PRO 6000 S$1.68 / hr · 2 offers
- RTX PRO 6000 WS$2.27 / hr · 1 offers
- H100 NVL$3.49 / hr · 2 offers
- H200 NVL$4.17 / hr · 2 offers
- H200$5.01 / hr · 2 offers
- B200$7.50 / hr · 1 offers
median offerlowest to medianSorted by median. Offers are listings seen at fetch time.
Model API list prices, per 1M tokens
Snapshot from OpenRouter, 2026-10-25 3:56 PM ET
Blended price: three input tokens for every output token. Paid on-demand models only; batch and free variants are left out.
- Paid models listed
- 347
- median blended $0.78 per 1M
- Cheapest blended
- $0.029
- Mistral: Mistral Nemo
- Priciest blended
- $263
- OpenAI: o1-pro
| Provider | Cheapest | Median | ||
|---|---|---|---|---|
| openai · 63 | 63 | OpenAI: gpt-oss-20b | $0.036 | $4.00 |
| qwen · 42 | 42 | Qwen: Qwen3.7 Flash | $0.055 | $0.40 |
| google · 28 | 28 | Google: Gemma 3 4B | $0.042 | $1.13 |
| mistralai · 20 | 20 | Mistral: Mistral Nemo | $0.029 | $0.43 |
| z-ai · 16 | 16 | Z.ai: GLM 4.7 Flash | $0.15 | $0.93 |
| anthropic · 15 | 15 | Anthropic: Claude Haiku 5.5 | $0.20 | $10.00 |
| deepseek · 14 | 14 | DeepSeek: DeepSeek V4 Flash 0731 | $0.067 | $0.32 |
| minimax · 9 | 9 | MiniMax: MiniMax M3.1 Flash | $0.26 | $0.52 |
| meta-llama · 8 | 8 | Meta: Llama 3.1 8B Instruct | $0.058 | $0.15 |
| meta · 8 | 8 | Meta: Muse Spark 1.2 Contributor | $0.13 | $2.00 |
| moonshotai · 8 | 8 | MoonshotAI: Kimi K2.5 | $1.00 | $1.21 |
| tencent · 7 | 7 | Tencent: Hy-MT2-1.8B | $0.077 | $0.14 |
| x-ai · 7 | 7 | SpaceXAI: Grok Build 0.1 | $1.25 | $1.56 |
| aion-labs · 6 | 6 | AionLabs: Aion-3.0-Mini | $0.87 | $1.00 |
| bytedance-seed · 6 | 6 | ByteDance Seed: Seed 1.6 Flash | $0.13 | $0.69 |
| nvidia · 6 | 6 | NVIDIA: Nemotron 3.5 Lightning | $0.10 | $0.22 |
| amazon · 5 | 5 | Amazon: Nova Micro 1.0 | $0.061 | $0.85 |
| cohere · 5 | 5 | Cohere: Command R7B (12-2024) | $0.066 | $0.60 |
| perplexity · 5 | 5 | Perplexity: Sonar | $1.00 | $3.50 |
| xiaomi · 5 | 5 | Xiaomi: MiMo-V2.5 | $0.15 | $0.38 |
Capital to compute
What a year of interest buys in GPU hours
Pick an amount and a rate. The interest is priced in rented GPU hours at the median Vast.ai offer.
Borrow calculator
Rate
Interest for one year
$7,000
$100,000 at Prime rate 7.00% (2026-10-21). At its low of 3.25% (2021-10-26): $3,250.
The same interest in GPU hours
- 13,060 hRTX 4090$0.54/h median · 544 days nonstop
- 9,887 hRTX 5090$0.71/h median · 412 days nonstop
- 6,162 hA100 SXM4$1.14/h median · 257 days nonstop
- 1,398 hH200$5.01/h median · 58 days nonstop
- 933 hB200$7.50/h median · 39 days nonstop
Median on-demand offer per GPU-hour, one snapshot from Vast.ai · 2026-10-25
Method
How the figures are made
Rates are the raw FRED observations, as published: 10-year Treasury and prime are daily, Baa and Fed funds are monthly averages. Nothing is smoothed or filled in. Where a series has no reading on a date, the last reading before it is used and the readout shows its date.
Low and peak are the lowest and highest readings in the fetched window. The 12 month change compares the latest reading with the one in force a year earlier. The trend is a least squares line through the last 12 months of readings, in basis points a year. GPU hours are one year of simple interest divided by the median per GPU-hour Vast.ai price.
The trend line is a least squares fit through the readings inside the range on screen, so it changes when the range does. The log axis spaces rates by ratio, so a move from 0.5% to 1% looks as big as one from 4% to 8%. Chronicle markers are the real, dated Chronicle events inside the range, placed on the first day of the month or year they are dated to.
The cost of building tab reads one Vast.ai listing snapshot and one OpenRouter price list, both fetched by the pipeline. API prices are blended at three input tokens to one output token.
Cite and embed
Use this chart
Free to cite and embed with a link back. The figures come from FRED, Federal Reserve Bank of St. Louis.
Key figures
- Prime rate (FRED DPRIME) was 7.00% on 2026-10-21, +375 bp from its 3.25% low on 2021-10-26, −25 bp over 12 months.
- Baa corporate bonds (FRED BAA) was 6.47% on 2026-09-01, +319 bp from its 3.28% low on 2021-11-01, +64 bp over 12 months.
- 10-year Treasury (FRED DGS10) was 4.96% on 2026-10-22, +361 bp from its 1.35% low on 2021-12-03, +99 bp over 12 months.
- Fed funds (FRED FEDFUNDS) was 3.75% on 2026-09-01, +367 bp from its 0.08% low on 2021-10-01, −47 bp over 12 months.
Chart image
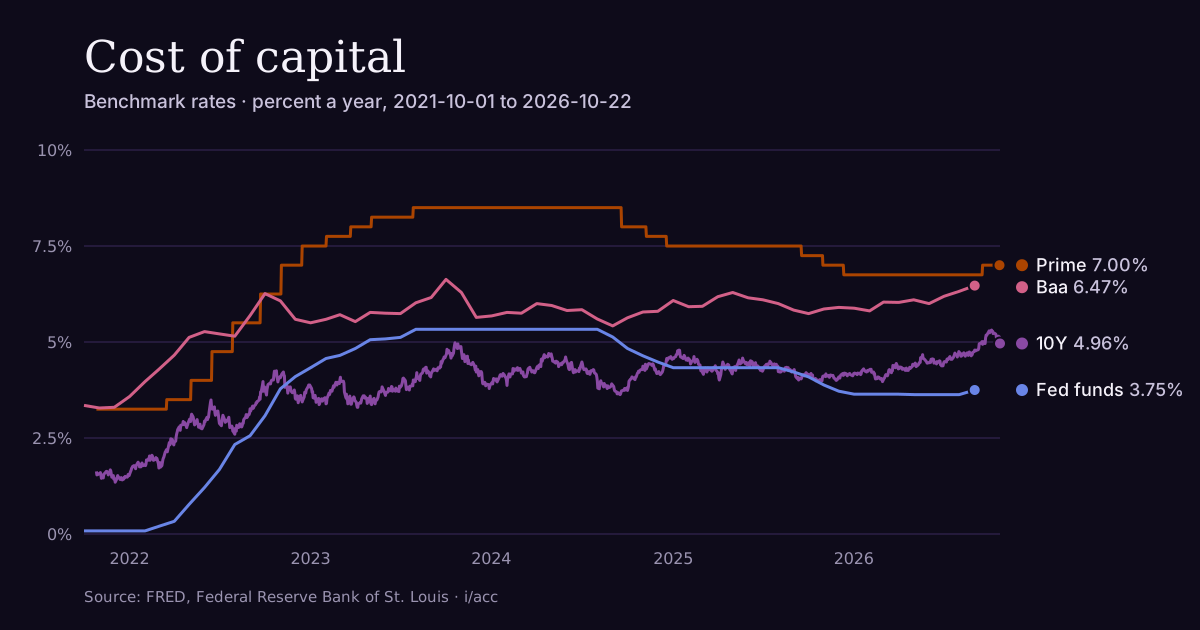
Vector image, rebuilt from the data on every deploy.
Live chart (iframe)
<iframe src="https://i-acc.si/embed/cost-of-capital" title="Cost of capital, live chart" width="100%" height="760" style="border:0;max-width:100%" loading="lazy"></iframe>
Embed
<a href="https://i-acc.si/indices/cost-of-capital"><img src="https://i-acc.si/indices/cost-of-capital/chart.svg" alt="Line chart of four US benchmark interest rates from FRED, 2021-10-01 to 2026-10-22" width="1200" height="630" style="max-width:100%;height:auto"></a>
Citation
i/acc. (2026). Cost of capital index [Data set]. Data from FRED, Federal Reserve Bank of St. Louis. Retrieved 2026-10-25, from https://i-acc.si/indices/cost-of-capital
Limits
What this page does not claim
- These are nominal rates. Inflation is not taken out, so a higher rate is not always a higher real cost.
- Prime, Baa and Treasury yields are benchmarks. What a small company pays sits above them and depends on the lender.
- Daily and monthly series are drawn on one axis. Monthly lines step once a month and hide moves inside it.
- The window is the five years the pipeline fetches. Lows and multiples are lows in that window, not all time.
- GPU and API prices are one snapshot each, not a price history or a market average.
- Trend lines describe the readings in the range. They are not forecasts of where rates go next.
Not financial, legal or tax advice.